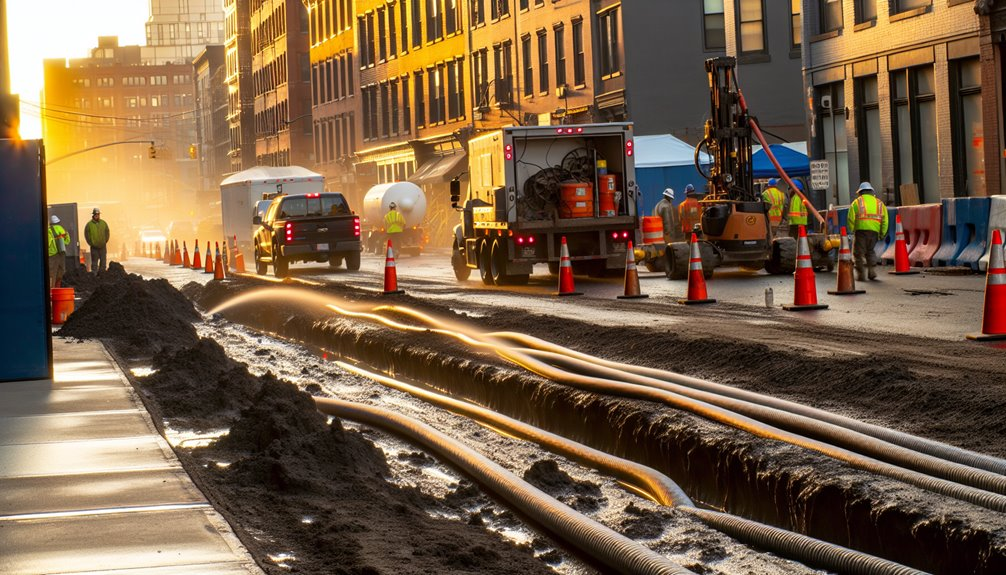
You’re choosing between open-cut trenching and trenchless (HDD, pipe bursting) under tight permit windows and congested corridors. Trenching often lowers unit pipe costs but raises traffic control, shoring, dewatering, and pavement restoration, extending schedules. Trenchless boosts mobilization and tooling but accelerates linear footage with fewer reinstatement delays. Geology, utility density, work-hour restrictions, and contingency allowances shift the breakeven. Production rates, crew sizing, and risk allocations tell a different story once you quantify them—especially under urban constraints.
Key Cost Drivers by Method and Site Conditions
Although both open-cut and trenchless methods deliver buried utilities, their cost structures diverge based on controllable inputs and site-specific constraints. You’ll quantify risk and budget by aligning method selection with geotechnical profiles, utility depth, traffic control obligations, and restoration standards (e.g., APWA color codes, MUTCD, local pavement specs). Key drivers include subsurface variability, groundwater control, spoil handling, and disposal fees.
For open-cut, pavement saw-cutting, shoring to OSHA 29 CFR 1926 Subpart P, lane-closure compliance, and surface reinstatement dominate unit costs. For trenchless, steering tolerance, bore path accuracy, pipe stress per ASTM/ASCE, and entry/exit pit logistics set pricing.
Material availability, lead times, and inflation shift both methods’ pipe, casing, and resin costs. Seasonal weather changes dewatering rates, thermal curing windows, and compaction efficacy, impacting contingency and schedule-dependent overhead.
Comparing Production Rates and Crew Requirements
With cost drivers defined, you can now benchmark output by method using measurable crew-hours and linear feet per shift. You’ll translate production into an output rate tied to crew size, shift length, and equipment mix.
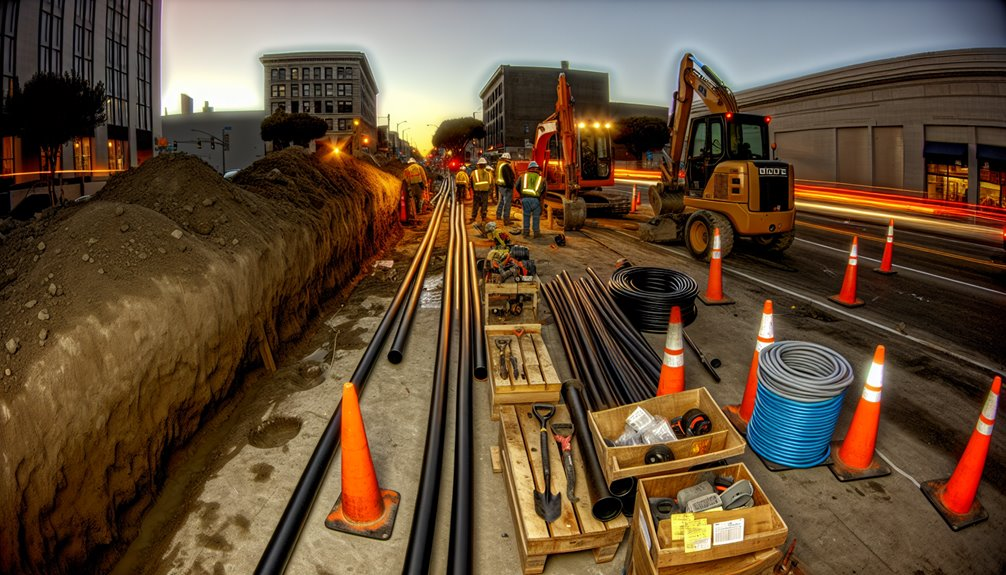
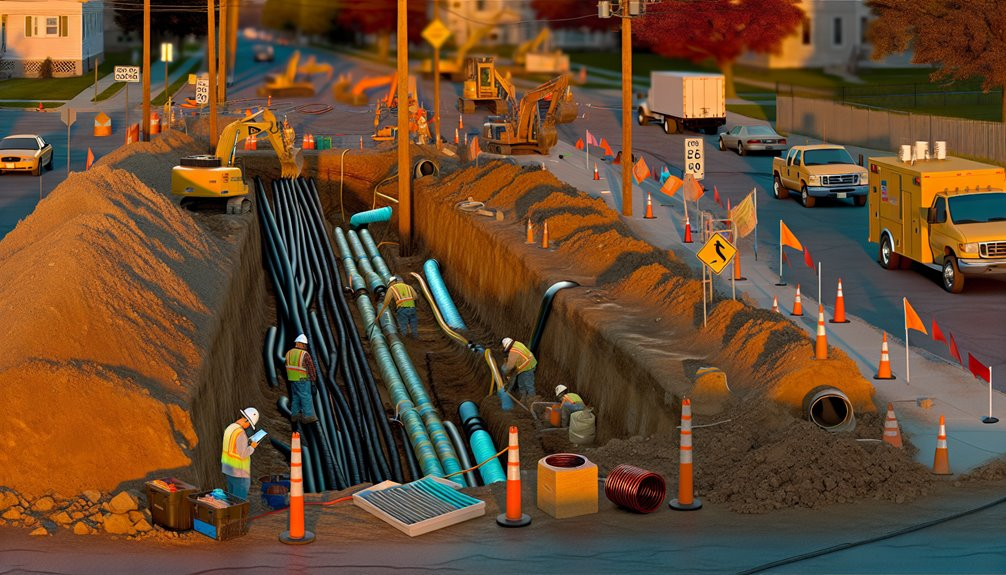
For open-cut trenching, typical crews of 5–7 with an excavator, loader, compactor, and traffic control average 150–400 LF/shift in urban corridors. Trenchless crews of 3–5 operating HDD or pipe bursting rigs often deliver 300–800 LF/shift once setup is complete. Normalize to LF/crew-hour to compare apples-to-apples and align with your QA/QC standards and permitting windows.
- Calibrate planned crew size and equipment mix to maintain continuous operations and minimize idle time.
- Right-size shift length to local ordinances and fatigue limits to sustain output rate.
- Track setup/tear-down separately to refine true LF/crew-hour.
Risk Profiles: Geotechnical Unknowns and Utility Conflicts
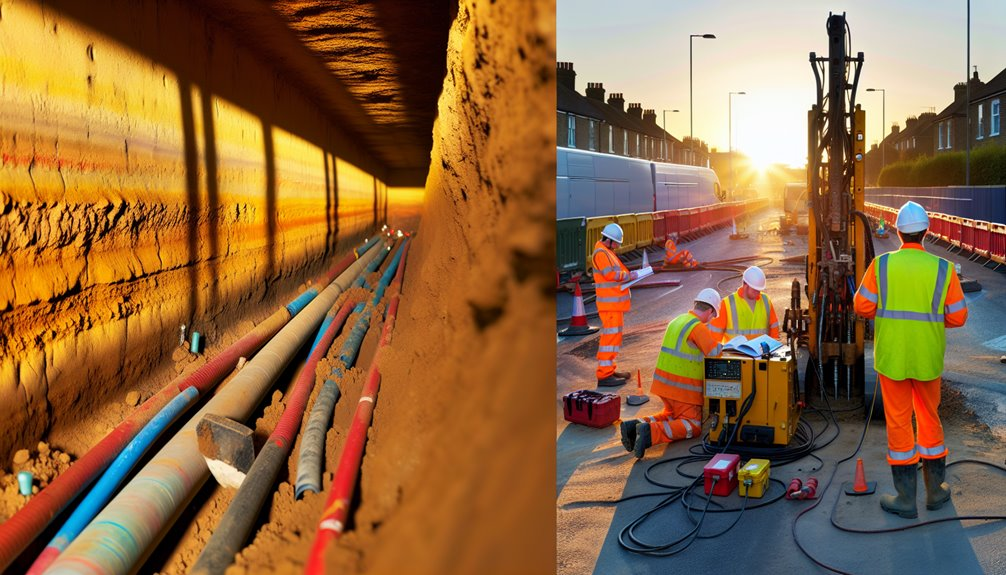
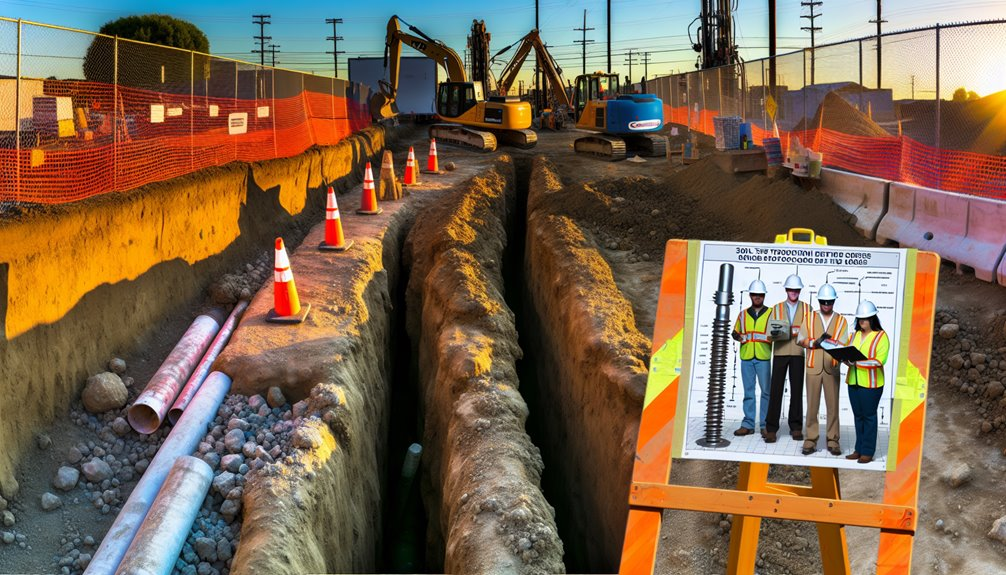
Even when cost and production look favorable, your risk profile hinges on subsurface certainty and utility congestion. You mitigate unknowns by front-loading geotechnical due diligence: ASTM D1586 SPT blow counts, CPT soundings, and lab index tests quantify soil variability and groundwater. Feed those data into HDD steering models, line-and-grade tolerances, and trench shoring designs per OSHA Subpart P. For utilities, enforce ASCE 38 Quality Levels and upgrade critical crossings to QL-A via vacuum potholing to reduce strike probability.
For open-cut, risk escalates with shallow bedrock, high water table, and dense utility congestion that forces hand-excavation and temporary support of existing lines. For trenchless, variability in cobbles or cemented tills drives torque/drag spikes, frac-out potential, and reamer wear; apply ASCE 75 record standards, drilling fluid balance calculations, and contingency allowances.
Traffic Control, Access Constraints, and Surface Restoration
Because traffic and surface impacts often drive public cost and schedule, you should quantify maintenance-of-traffic (MOT) and restoration scope early using standards-based assumptions. Compare trenching and trenchless using unit rates tied to anticipated lane closures, pedestrian detours, work windows, and pavement restoration by functional class. Apply MUTCD/ECTD guidance for taper lengths, buffer spaces, and accessible routes. Capture surface replacement to jurisdictional specs: asphalt section, joint sealing, striping reset, ADA ramp compliance, and landscape or hardscape reinstatement.
- Use production-based MOT models (crew-hours per segment) to normalize trenching vs. trenchless under identical lane closures and pedestrian detours.
- Price restoration with pay items by square yard, thickness, and rideability indices (IRI).
- Evaluate access constraints: driveway outages, transit stops, emergency response, and night-work constraints with noise limits.
Permitting, Mobilization, and Lead Times

Quantifying MOT and restoration sets the stage for schedule reality: permitting, mobilization, and lead times often control the critical path for both trenching and trenchless.
You’ll quantify Permit durations by jurisdiction and permit class (encroachment, lane closure, railroad, environmental). Reference published SLAs where available and validate with agency PMs. Align utility locates (811), traffic control submittals, and preconstruction meetings to avoid idle time.
Establish mobilization logic: equipment staging, pits or shoring, spool delivery, and crew sequencing.
For HDD or pipe bursting, long-lead tooling, tracking systems, and drill strings can drive float consumption. Contractor availability matters; prequalify crews, confirm equipment counts, and lock calendars with letters of intent. Build a risk-adjusted schedule using P6 or Last Planner, include procurement lead times, and baseline against spec-mandated milestones.
Hidden Costs and Common Change Order Triggers
While bid tabs capture excavation, pipe, and restoration, your cost exposure often spikes from unpriced risk: unforeseen obstructions (debris, boulders, abandoned utilities), utility conflicts from poor as-builts, groundwater inflow, contaminated spoils (RCRA/non-RCRA), and MOT extensions that blow through lane-closure allowances.
You see change orders when production rates collapse from unexpected obstructions, HDD frac-outs trigger environmental controls, or trench shoring upgrades are required to satisfy OSHA and local trench safety standards.
Add premium charges for night work, police details, lane-rental, and spoil profiling per 40 CFR. Stakeholder disputes over access, vibration, or noise also extend schedules and liquidate float.
- Pre-bid SUE (ASCE 38/CI/ASCE 75) reduces utility conflict allowances.
- Hydrogeologic testing informs dewatering design, discharge permits, and backup power.
- Clear CO language: unit-price triggers, standby rates, and differing site conditions definition.
Decision Framework and Sample Cost-Timeline Scenarios
Before selecting open-cut or trenchless, anchor decisions to a gated framework that scores alignment, geotechnical, hydraulic, and risk factors against cost and schedule KPIs. You’ll populate a decision matrix using ASTM F1962 pullback limits, ASCE 38 utility quality levels, traffic control hours, dewatering intensity, and restoration classes. Weight criteria (e.g., 30% risk, 25% schedule, 25% capex, 20% O&M) and run sensitivity.
Sample cost scenarios:
- Urban, 400 ft, 12-in water: Open-cut $1,150/lf, 20 days (night work, MOT, full restoration). HDD $850/lf, 10 days (pilot, ream, pull, hydrotest).
- Suburban, 1,200 ft, 8-in gravity: Open-cut $350/lf, 18 days (shoring, manholes). Microtunnel $600/lf, 14 days (jacking shaft, launch/receive).
- Rocky hillside, 600 ft, 6-in gas: Trenching $500/lf, 16 days (hammering). HDD $1,000/lf, 12 days (rock ream, fluid management).
Choose the option with the highest composite score.
Conclusion
As the owner of Boring Bros., I weigh trenching’s lower unit costs against the added expenses for traffic control, shoring, and restoration under MUTCD, OSHA Subpart P, and ADA requirements, while recognizing that trenchless options like HDD and pipe bursting carry higher mobilization and tooling costs but can dramatically increase LF/day output, reduce reinstatement, and keep projects on schedule during tight work windows. I always make sure we quantify geotechnical risk with CPTs and borings, assess utility congestion per ASCE 38/75, and factor in permit lead times, plus a sensible contingency for change orders from ground loss, frac-out, or unknown utilities. My goal is to recommend the method that minimizes lifecycle cost and schedule variance for your specific job. If you’d like to talk through your project, please visit boringbro.com to learn more or call me at (954) 639-6167 — I’d be glad to help.